

In the context of my Ray Tracer Challenge, I wanted to run some performance analysis on my basic operations and data structures. For this installed and used BenchmarkDotNet, an OSS benchmarking tool used by Microsoft for performance testing the .NET Core runtime and class library.
In this post, I'm going to share what I learned about this powerful tool.
How to install BenchmarkDotNet
BenchmarkDotNet is not an application you have to install. It is a .NET library. To install it, create a console application and install the NuGet package.
dotnet new console
dotnet add package BenchmarkDotNet
As simple as that.
Writing benchmarks
Now that you have the project, you need to create a class with the benchmarks you want to run, and finally, add one line to the Main of the Program to start the execution of the benchmarks.
Here a simple example that shows how to test the "performances" of the Sleep method.
using System;
using System.Threading;
using BenchmarkDotNet.Attributes;
using BenchmarkDotNet.Running;

namespace MyBench
{
    public class Sleeps
    {
        [Benchmark]
        public void Time50() => Thread.Sleep(50);

        [Benchmark(Baseline = true)]
        public void Time100() => Thread.Sleep(100);

        [Benchmark]
        public void Time150() => Thread.Sleep(150);
    }

    class Program
    {
        static void Main(string[] args)
        {
            var summary = BenchmarkRunner.Run<Sleeps>();
        }
    }
}
Notice that every method has the [Benchmark] attribute.
Running benchmarks
Now it's time to run the benchmarks. To do it, just run the console application: dotnet run.
Unfortunately here you encountered the first problem, indicated by a red line in the terminal: you cannot run a benchmark in debug mode.
Assembly MyBench which defines benchmarks is non-optimized Benchmark was built without optimization enabled (most probably a DEBUG configuration). Please, build it in RELEASE. If you want to debug the benchmarks, please see https://benchmarkdotnet.org/articles/guides/troubleshooting.html#debugging-benchmarks.
Unless you want to run the benchmark in debug mode, you have to run it in release mode: dotnet run -c Release.
At this point, you see either one or two more red messages in the terminal, but the execution goes on and complete successfully.
The first complains that there is no solution file. Since you only created a project, this is normal. So skip over it.
The second, which might not appear depending on the OS and permission of the users you logged in with, is also not affecting the success of the execution but might affect the results.
Failed to set up high priority. Make sure you have the right permissions. Message: Permission denied
This message means that the benchmark runner was not able to set the execution to high CPU priority, so the benchmark will run slower, especially if other applications are running at the same time.
If you encounter this problem, either run the command as Administrator on Windows or sudo it if running on Mac or Linux.
Having solved the two issues, the correct way of starting the benchmark is sudo dotnet run -c Release.
Analysing the results
After a while (the example of this post took 45 seconds to complete), you get a summary with the mean execution time of all your benchmarks. By default, you get:
- Markdown (Github dialect)
- HTML report
- CSV you can import in Excel for additional analysis
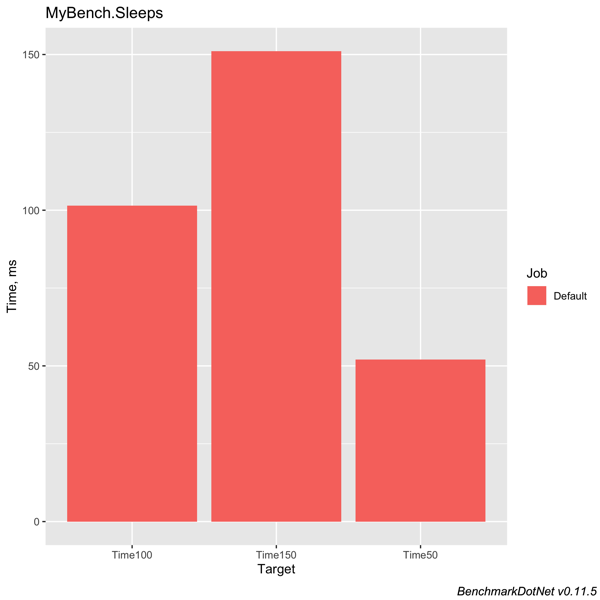
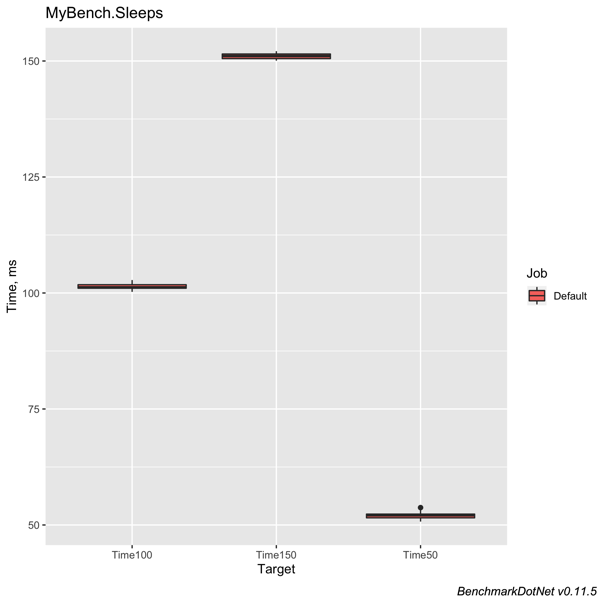
As example this is what I got from my machine:
| Method | Mean | Error | StdDev | Ratio |
|---|---|---|---|---|
| Time50 | 52.28 ms | 0.4682 ms | 0.4380 ms | 0.51 |
| Time100 | 101.99 ms | 0.9778 ms | 0.9146 ms | 1.00 |
| Time150 | 151.74 ms | 0.9426 ms | 0.8817 ms | 1.49 |
Usually, you'd get only the Mean, Error and StdDev columns, but since one of the benchmarks was marked as baseline (using the attribute [Benchmark(Baseline = true)]), there is also the Ratio column, which tells you the relative difference in performances.
BenchmarkDotNet can also generate plots with a summary of the results and with a detailed analysis of each execution. It relies on R (a statistical analysis framework) for the execution, so you'd need to install it. On Mac, it's as easy as brew install r.
Additional features of BenchmarkDotNet
We just scratched the surface of BenchmarkDotNet. It has many more features that allow you to run benchmarks under different conditions.
Environments
You can, for example, ask to run the same benchmark on different frameworks, like .NET Core, Mono, x86 or x64 and then compare the results. This is configured via attributes, [CoreJob, ClrJob, MonoJob], or by providing a configuration object.
Parameters
Another interesting feature is the possibility of executing the same benchmarks with different parameters, for example, to see if a particular operation degrades when the number of iterations increases. This is also done with an attribute, [Params].
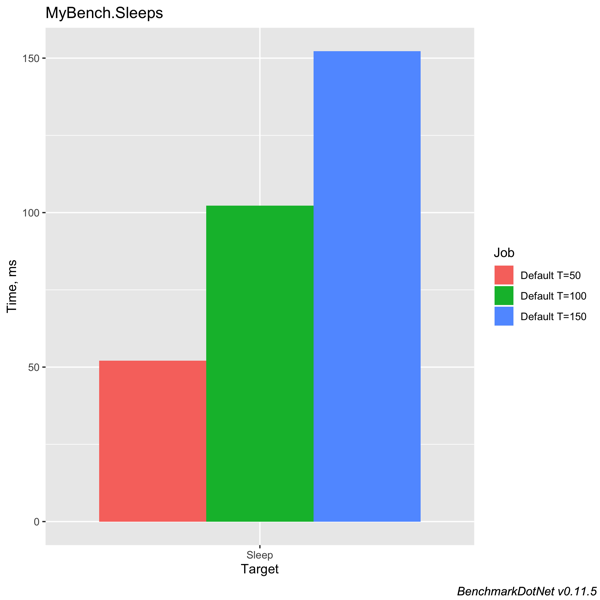
For example, the same Sleep test could have been done using parameters instead of creating three different benchmarks.
public class Sleeps
{
    [Params(50, 100, 150)]
    public int T { get; set; }

    [Benchmark]
    public void Sleep() => Thread.Sleep(T);
}
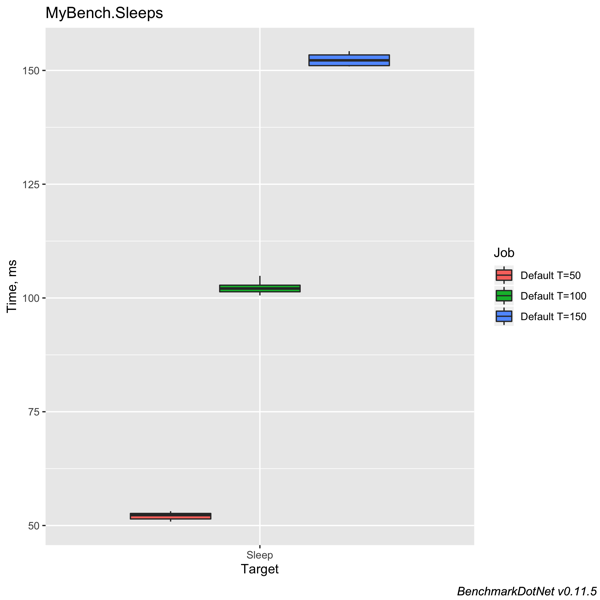
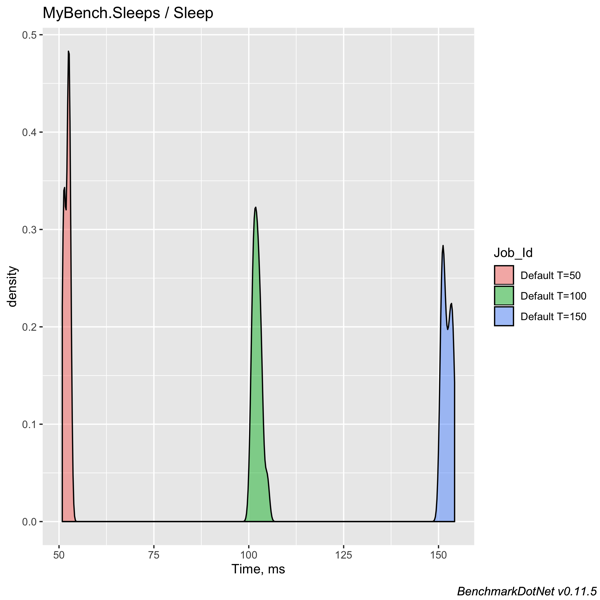
The result is slightly different:
| Method | T | Mean | Error | StdDev |
|---|---|---|---|---|
| Sleep | 50 | 52.09 ms | 0.7825 ms | 0.7319 ms |
| Sleep | 100 | 102.21 ms | 1.2101 ms | 1.1319 ms |
| Sleep | 150 | 152.25 ms | 1.3064 ms | 1.2220 ms |
This approach makes it also more comfortable to compare the results using the default plots generated with R, as some of the charts become more useful.
Running benchmarks
You have already seen the most straightforward way of running the benchmark by merely running the project.
Unfortunately, this method is very limited.
Specifying console arguments
A better method is to change the Main to use BenchmarkSwitcher.
static void Main(string[] args)
            => BenchmarkSwitcher.FromAssembly(typeof(Program).Assembly).Run(args);
This allows a lot of parameters to be passed to the benchmark execution. You can filter which benchmarks to run, change the runtimes on which to run, and specify other configurations parameters that otherwise had to be specified in code or with attributes directly in the benchmark.
Using the global dotnet tool
A final way of running benchmarks is via the global dotnet tool.
You can install it via dotnet tool install -g BenchmarkDotNet.Tool.
Once installed you can run a benchmark by specifying the name of the dll (dotnet benchmark MyBench.dll), and then the same console arguments as with the BenchmarkSwitcher.
Conclusions
I hope I gave you a good overview of this fantastic tool. You can read more information on the official web site https://benchmarkdotnet.org.
While exploring this tool, I tried testing the performance of various ways of concatenating strings. Is StringBuilder faster or slower than String.Join? Subscribe to my RSS feed or follow me on Twitter to get notified when my analysis on this gets published.